
The Huygens-Fresnel principle describes sound as spherical waves emanating
from a source
17 (Figure 4). Each point on the wavefront is considered a source of
secondary spherical wavelets with appropriate amplitude and phase. The amplitude of
the pressure field in front of the wavefront is the superposition of these wavelets,
taking into account their relative amplitudes and phases. The amplitude of each
wavelet is largest in the direction of the original wavefront's propagation and zero in
the opposite direction. The relative amplitude of each portion of the wavelet is
described by the obliquity factor
 , where
 is the angle between the
wavelet's direction and the original wavefront's propagation direction. Kirchhoff
diffraction theory puts the Huygens-Fresnel principle into mathematical form by
solving the scalar differential wave equation.
There are several ways to calculate the pressure field based on the Huygens- Fresnel principle/Kirchhoff's diffraction theory. Kirchhoff's diffraction theory expresses the complex pressure at a point in image space by the two-dimensional Kirchhoff integral. This can be solved numerically at each desired point in the pressure field to find the complex pressure. The Huygens-Fresnel principle can also be used more directly to find the pressure at a point by summing the contributions of virtual point sources arrayed on the final surface of the lens system. This requires expressing the principle mathematically as a summation rather than an integration, but approaches the Kirchhoff integral in the limit.
2.1 Kirchhoff Integration Method
Cornelius & Williams evaluated the Kirchhoff integral at points in the pressure field in order to find the complex pressure. The complex pressure field on the exit plane of the lens is used as the boundary conditions that are needed to solve the Kirchhoff integral. The exit plane of the lens is a plane normal to the principal (x) axis of the lens system, placed immediately after the final lens surface (see Figure 5). A collection of rays are traced through the lens, keeping track of the amplitude and phase of each ray. The complex pressure on the exit plane is the amplitude and phase of each ray where it intersects the exit plane. The magnitude is also scaled by the density of rays intersecting the exit plane near each point.
Because the rays will pass through a smaller section of the plane if the exit plane is placed farther from the final lens surface, more diffraction effects will be lost, resulting in decreased accuracy. Thus the exit plane is placed as close as possible to the final lens surface.
In terms of the coordinate system shown in Figure 5, the Kirchhoff integral is written as 11, 17

where
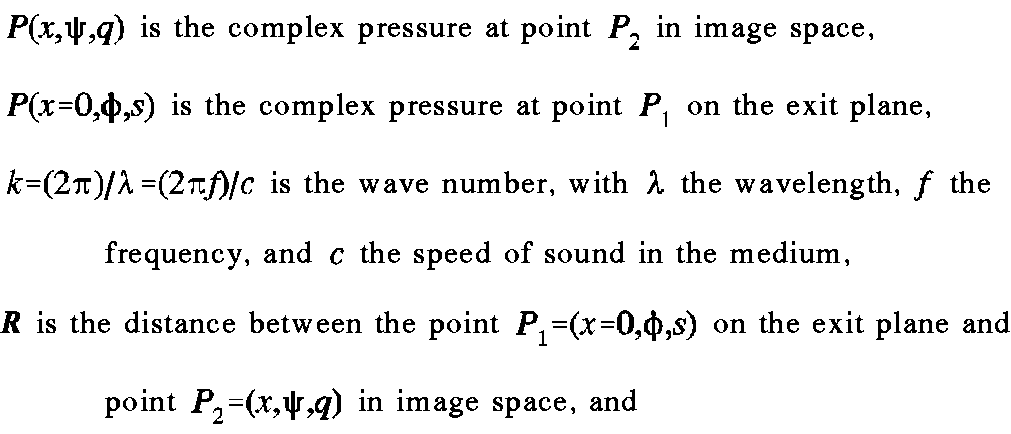
Expanding the partial derivative, the integral becomes

For R large with respect to the wavelength of sound, this can be approximated by

Cornelius & Williams analyzed an axially symmetric lens. Therefore,

is set to 0, so q=y and the pressure on the exit plane

becomes a function of s only, simplifying the equation to

In these equations, the obliquity factor is approximated by the x/R
term, which becomes

for a parallel wavefront (the incoming rays are parallel to the x-axis),
which is approximately equal to
 for small
 .
.
In order to numerically evaluate this integral, Cornelius & Williams used Simpson's Composite Integration Formula with a fixed order of 50 in each dimension. This is a conceptually simple approach, but it does not guarantee either convergence or efficiency. Numerical integration using Simpson's Formula of order 50 does not converge properly for some lens configurations but would converge at a much smaller order (and thus more quickly) for others. Lack of convergence of the inner integral leads to a large error after performing the outer integral even if the outer integral converges, since its integrand is incorrect. Increasing the order to a larger number ensures convergence, but also dramatically increases the time required to compute the integral.
A second numerical integration algorithm was implemented in order to improve the numerical integration in the simulation. The Romberg integration formula is an adaptive scheme that uses polynomial interpolation and successively decreasing step sizes to quickly evaluate the integral. The integration tolerances can be changed to balance accuracy against speed, and the integration only proceeds until convergence is reached, reducing the overall time required. This method results in faster evaluation of the integral in most cases, and provides more security in terms of convergence for all lens systems.
An alternate method for finding the pressure field behind a lens simplifies the calculation by dispensing with the transformation from discrete to continuous representation and then from continuous back to discrete representation as is required for numerical integration. In the Kirchhoff integration method, the first step is discrete: a finite number of rays are traced through the lens system to the exit plane. Then a continuous function is synthesized from them to place within the integral. Finally, the integral is evaluated by approximating it numerically as a summation.
In the summation method, rays are traced from a source through the lens system, but terminate on the final lens surface rather than continuing to an exit plane. This eliminates the errors that arise from assuming no diffraction occurs between the final lens surface and the exit plane. Each point on the final lens surface where a ray hits is considered a point source as in Kirchhoff's diffraction theory. Rather than evaluating an integral for each position in the resulting pressure field, however, the contribution of each point source, weighted according to the obliquity factor and its distance to the point of interest, is summed.
Referring to Figure 6, assume that N rays have been successfully traced through the system. Let V[n] denote the (x,y,z) coordinates of the point where ray n intersects the exit surface and P[n] represent the complex pressure of that virtual source. Further, let D[n] be a direction vector representing the ray's direction of travel at that point. The distance from each virtual source to the image point is

The direction vector from each virtual source to the image point is
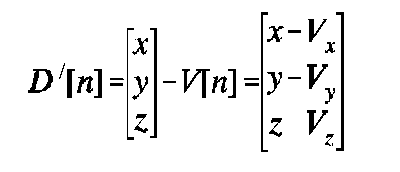
The obliquity angle is the angle between each ray's terminal direction of travel and the direction from the virtual source to the image point:

The obliquity factor is:
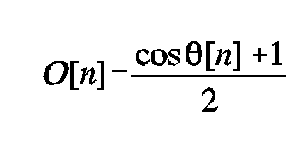
The attenuation due to the absorption of the fluid between the exit surface and the retina is found by multiplying the fluid's attenuation coefficient, in dB/cm, by the distance from the virtual source to the image point, in cm, then converting from dB to magnitude:

The final factor is the point spread (or Green's) function for the virtual source:

The complex pressure at any point in image space will be the sum of the contributions of all the virtual sources, taking into account the relative magnitude and phase of each virtual source.

Substituting in the previously described functions, the equation becomes:
 (5)
(5)
Equations (4) and (5) should be equivalent in the limit, but some differences
are apparent. The summation method has an attenuation term, which was not included
in the integration method. The obliquity factor in the summation method is
approximated by the x/R term, as discussed earlier.
The boundary values P(s) on the
exit plane for the Kirchhoff integral are replaced by values P[n]
on the final lens
surface for the summation method. The summation method does not have the
-i term and thus differs from the integration method by a
 /2
phase shift.
This is missing from the Huygens-Fresnel theory
17
, but since only the relative
phases between points in the pressure field are of interest, it is unnecessary to include
it.
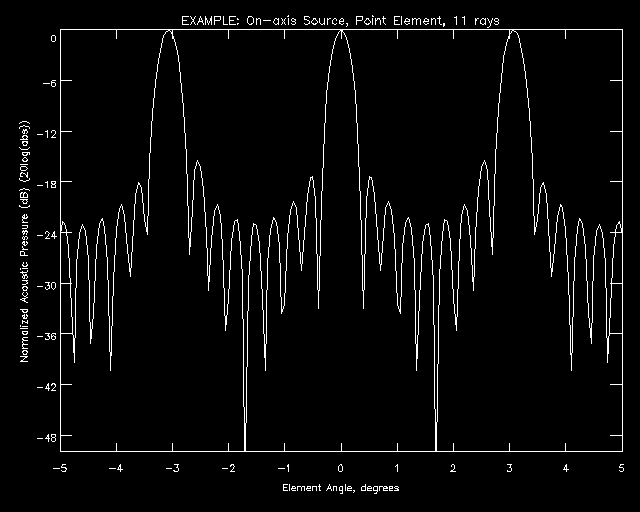
When using the summation method, convergence depends on the number of rays traced through the lens system. If an insufficient number of rays are traced, the beam patterns will be spatially aliased. Spatial aliasing is avoided in the integration schemes discussed above by checking that the integrand is sufficiently smooth before performing the integration. However, spatial aliasing is quite easy to detect in beam patterns due to its regularity, and can be avoided by choosing a sufficient number of rays.
A general rule of thumb is to choose the spacing of rays between
 /10
and
 /2
18
. For example, for a 900 kHz system with a 30 cm aperture,
 /2
corresponds
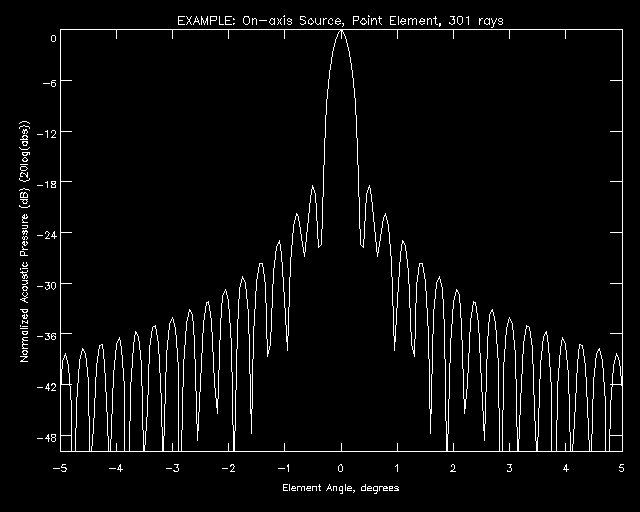
to 373 rays. Figure 7 shows the generated beam pattern for an example system using
301 rays. In a beam pattern generated by tracing only 11 rays (Figure 8), aliasing is
clearly visible. However, increasing the number of rays traced only to 31 moves the
aliased mainlobe out to 6.73 cm (7.95 degrees ), reducing the effects of aliasing on the
mainlobe and first two sidelobes to less than 1%. The rule of thumb described above,
then, is very conservative. For this example, 31 rays, corresponding to about
5
 , is sufficient for good accuracy.
Return to Title Page and Table of Contents
kevin@fink.com